
Power BI is a business analytics tool used by various IT companies for analyzing data. Apart from dashboard and visualization, there is another kind of reports that are known as paginated reports. Today, we will learn about Power BI paginated reports and how we can create them using Power BI Report Builder tool. This blog will cover the following topics.
- What Is Power BI?
- What Are Paginated Reports?
- Power BI Report Builder
- Create Power BI Paginated Reports
- Conclusion
What Is Power BI?
Power BI is a business intelligence and analytics tool provided by Microsoft. Most companies use this tool for their business monitoring. Power BI is helpful to analyze data, generate reports and create data visualization. It can link with Microsoft Azure cloud services and be embedded in web and mobile applications. There are various types of Power BI tools available for different platforms.
Types of Power BI tools
- Power BI Service – It is a cloud-based software service used on browsers.
- Power BI Desktop – It is computer software that you can download from the official Microsoft Store.
- Power BI Mobile – It is a portable app for Android and iOS platform.
- Power BI Report Builder – This is another desktop tool designed to create Paginated Reports.
What Are Paginated Reports?
Paginated Reports are special kind of reports that a user can fully customize. These reports are called paginated because a user can format them in page layout for printing purpose. Report designers can control the full page layout and every pixel of the page as they want, and that’s why these reports are also called pixel perfect. Designers only create one layout containing syntax and expressions to print and publish all the data present in a dataset. Paginated reports are beneficial for the companies to print invoice and sale records.
Power BI Report Builder
Microsoft provides a separate tool for creating paginated reports. To create Power BI paginated reports, you need to download Power BI Report Builder to your system. You can download the Power BI Report Builder from Microsoft’s official site.
1. Know Your Workspace
After downloading and installing Power BI Report Builder, you will see a similar screen shown in the image below.
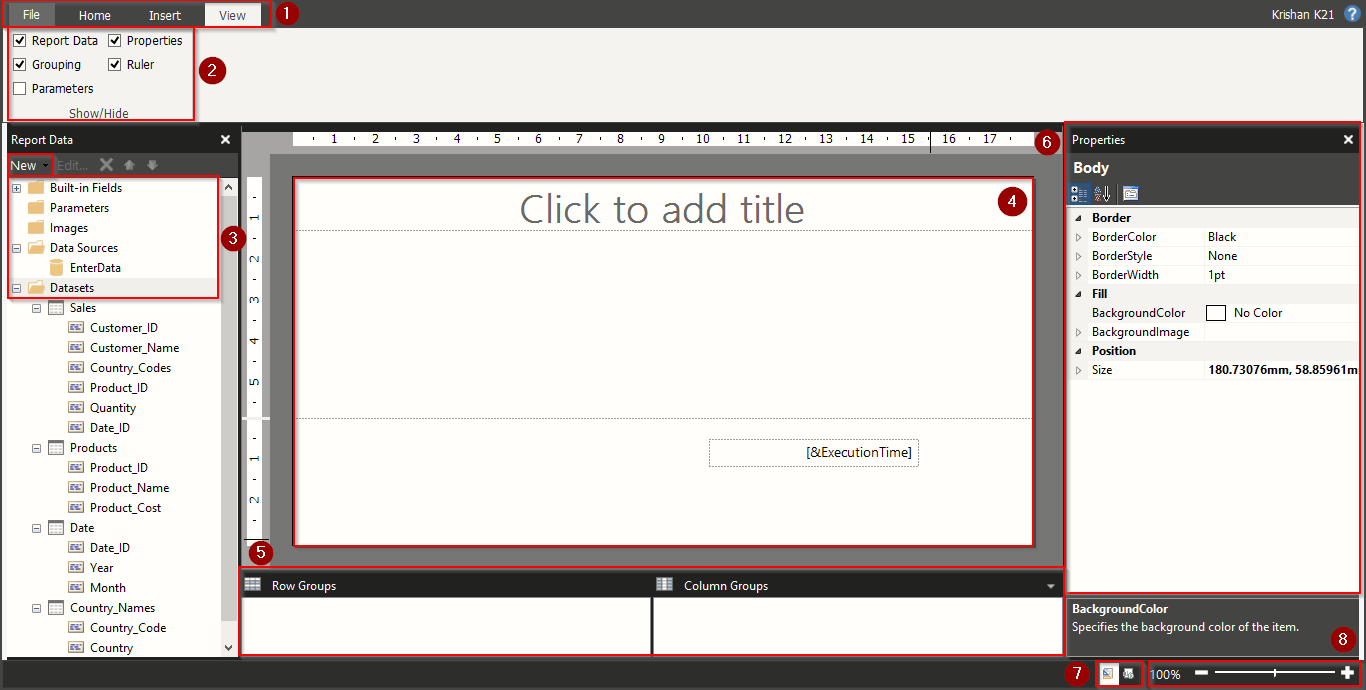
- This is the menu bar of the report builder. Select the menu that you want to see and explore.
- If something is missing on your screen, visit the ‘View‘ menu and check the options to add and remove widgets from your screen.
- This widget here at the extreme left contains all the data and data sources for your current project. All your tables and data is present inside the ‘Datasets‘ folder.
- This area will be available to insert various tables and objects to create the layout of your paginated report.
- Widget on the extreme bottom will show your connected data groups that help to link all the pages with some common entity attributes.
- The right sidebar will contain the properties that will be helpful to adjust the size, colour and location of your objects.
- These two little buttons are two different tabs. The first one is the ‘Design‘ tab where you are currently present. The second one is the ‘Run‘ tab, where your reports will be compiled and executed.
- On the bottom right, you can see this adjustment bar to fit your reports on your screen. This will be helpful for you to zoom in and out on a specific object.
2. Create Your Data Source
In Power BI Report Builder, we need first to define the location of our data. This data location is known as the ‘Data Source‘. To create a data source, see the below image and the steps.

- Click on the ‘New‘ drop-down button. This option will help you define a ‘Data Source‘ and ‘Dataset‘.
- Before importing data, we need to define our data source, so select ‘Data Source‘.
A Data Source properties window will appear in front of you, as shown in the image below.

- Click on the General tab to define your data source.
- Enter the name of your data source here.
- Click on this drop-down menu and select the source of your data.
If you don’t have any server and want to import sample data from your excel files only, choose ‘Enter Data‘ as your data source. Click on the ‘OK‘ button, and you are ready to import your data.
Use Server As Your Data Source
If you want to import data from the Microsoft SQL Server, you will need credentials to access the data present in the server. You need to fill in all your server details in the ‘Credentials‘ tab present in the left side pane below the ‘General‘ option, as shown in the above image. After selecting the data source type, click on the ‘Build‘ option to define the connection properties. We have shown a brief overview in the steps below for using this method to import data.

- After choosing the Microsoft SQL Server option, select the server name.
- Fill in the authentication details.
- This option will help you to test your connection with the server.
- Click on the ‘OK‘ button after filling in all the details.
3. Import Data In Report Builder
We will use the product sales data in our reports to create an invoice for customers who purchased the product. To practice and follow this tutorial side by side, you can download our sample data from here.
To import data, you need to create a Dataset that contains all your imported data.

- Click on the ‘New‘ button on the left side pane, as shown in the above image.
- Then click on ‘Dataset’. It will open up the ‘Dataset Properties‘ window.
Dataset Properties

- Enter the name of your dataset.
- Select the data source that you have just created in the previous steps.
- Depending on your data source, these will be automatically selected. You will select the tables you want to import for ‘SQL Server‘ as a data source. After the selection of tables, press ‘OK‘.
- If you don’t have the server and selected ‘Enter Data’ as your data source in the previous steps, then click this query designer to paste your data.
Query Designer

After opening the query designer window, you will see a similar screen without data. Select and copy all the cells from your excel sheet that you want to use as your data.
- Click on these corners or edges to extend rows and columns in a table.
- Select the table’s first cell and paste your data by pressing the key ‘Ctrl with V‘ on your keyboard.
- You can double-tap on the column headers to rename. When your data is perfectly arranged, click the ‘OK‘ button to exit this window.
Similarly, you can add more tables to your dataset by right-clicking on the ‘Dataset‘ option on the left side pane.
Create Power BI Paginated Reports
We have successfully imported our data. Now let’s create paginated reports using Power BI Report Builder. We will create an invoice for the customers who purchased the product.
1. Create List

- You can see all your data source, dataset and tables here in this pane. These will be only visible if you have successfully created and imported the datasets.
- Visit the ‘Insert‘ menu on the top to see all the widgets and tools for creating the paginated reports.
- The list helps to use a common page layout to print all the data using some key attributes.
- After clicking on the List tool, click on this area and drag it down to create a list box. This list will include all our reports.
2. Modify Tablix Properties

After drawing the list, select the list box. Then right-click on the top left corner of the list to open the Tablix Properties window as shown in the above image. This step is essential to assign the tables that this list will use.

You will see the Tablix Properties window as shown in the above image. Here on the left side, you will see certain options available. You can use these options to set visibility and sorting details in the list.
- Click on the ‘General’ tab to reveal all the basic settings for this list.
- Enter the name of the list that you want to use.
- These are the name of tables that are present on your imported dataset. Select the ‘Dataset‘ name that you want to use in your report. This step is significant to extract and insert data on your list.
- After applying all the settings, press the ‘OK’ button.
3. List Grouping

We need to define some key attributes from the table. These attributes are the name of the columns used to show all our reports sequentially. This step is also important if you don’t want to get errors in your reports.
- Select your table again and right-click on it to open the list settings.
- Click on Add Group.
- Select the ‘Parent Group‘ as shown in the above image.

A ‘Tablix Group‘ window will appear on your screen, as shown in the above image.
- Select the column name that you want to use as your key to generate reports. In our case, it is ‘Customer ID‘. We will use this to generate an invoice for each customer.
- After choosing the values, press the ‘OK’ button.

After completing this step, you will notice some changes in the bottom grouping window shown in the above image.
- This is the grouping window present at the bottom. If you don’t see this window enable it using the ‘Insert‘ menu.
- Right-click on your recently created group to open the group properties.
- This is the ‘Group Properties‘ window. Visit the ‘Page Breaks‘ tab from the left side pane.
- This option will divide the page using our group that contains ‘Customer_ID‘ as a unique column attribute.
- Press the ‘OK‘ button to exit this window.
4. Manage List And Tables
We have now applied the required settings to fill the data on our list.

- Select the list and right-click on the edges to add rows and columns. The left edge is for a row, and the top edges are for columns.
- Select ‘Insert Row’ to open the row options.
- Always choose ‘Inside Group‘ in a grouped list to access the same data in all the rows and columns. Similarly, add more rows and columns depending on your need.
5. Insert Tables In List
You can use the ‘Insert‘ menu on the top to choose and draw objects on your page. We will directly add the objects to our list, as shown in the image below.

- Select the list and right-click on it.
- Click ‘Insert‘ to add different types of object and views to a list.
- Select ‘Table‘ to add show structured data in our report
6. Using Data Expressions
Following the above steps, a user can insert a default table into the list. This table contains some default textboxes. You can fill in the texts by right-clicking on the cells. Let’s add some data to these tables.

- Right-click on the table’s cell to view the ‘TextBox‘ settings.
- Select Expression to extract data from your dataset.

An expression window will appear in front of your screen, as shown in the above image.
- The first box contains the category. Here you can choose data, parameters, operators and some common functions to calculate your data.
- You can see the table’s name in the brackets that you have selected as your dataset for this list in the’ Fields’ option.
- This box will show you all the items present in a selected category.
- The last box shows all the values or columns present in a table.
- Double click on the value that you want to show in the selected cell.
- This will be the expression for the cell that will show the values in a report.
7. Run Power BI Paginated Report
Using all the above methods, you can create the page layout based on your requirements. You can add tables, images, matrix, line, rectangles, and many more objects to your report.
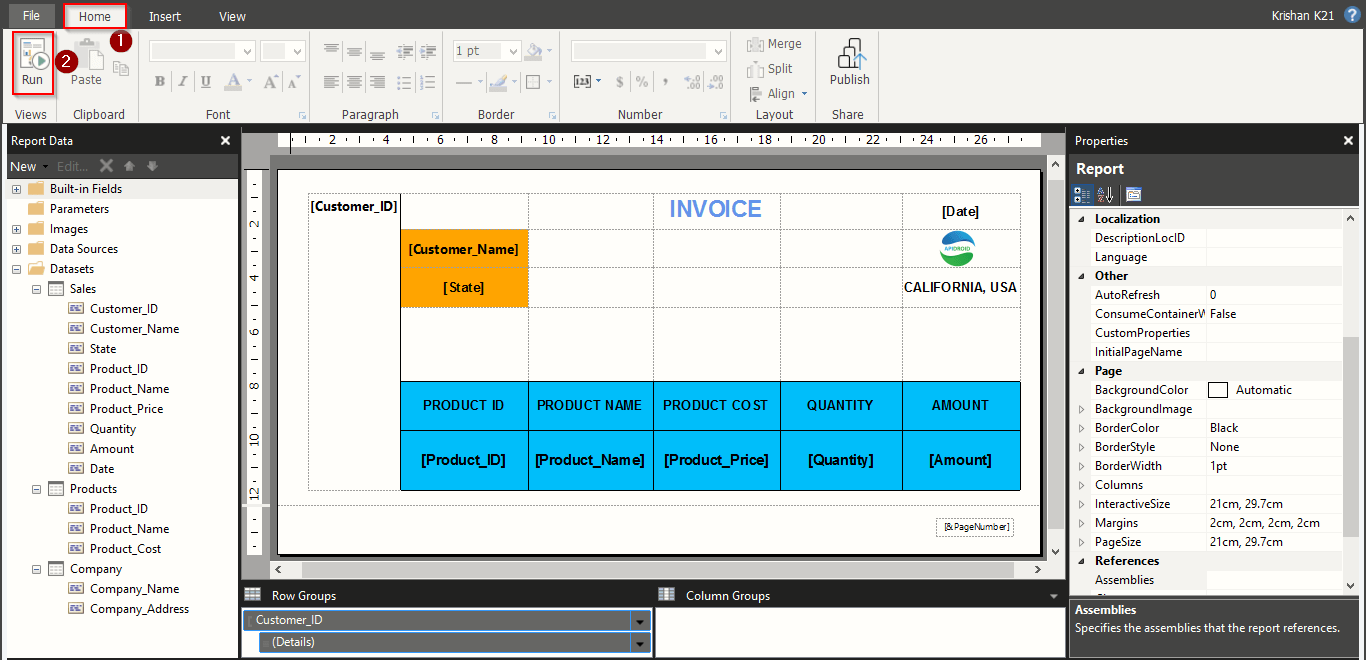
By adding some more details, we have designed this final page layout for our report. When you are ready with your design, run your reports to see the final pages.
- Make sure you are on the ‘Home‘ menu.
- You will see here an option ‘Run‘. Click this to execute your report. If your reports include any incorrect syntax and data expressions, Power BI will show an error.

In our case, the report is successfully executed, and our simple invoice is ready.
- Remember, we enabled page breaks after every row group. Therefore, this is the first page on the screen, and this report contains five pages. Using the ‘Next‘ and ‘Previous’ option, we can see all the pages in our report.
- This ‘Print Layout‘ option will help you to set your page size. We have used landscape mode for our invoice.
- Next is the ‘Export‘ option to deploy your paginated reports into PDF, Word, Excel and various other file formats.
- If you want to change your page layout design, you can use this ‘Design‘ option to go back to your report.
Conclusion
Through this blog, we have learned to create simple Power BI paginated reports. We can design every single pixel of the report using various Power BI Report Builder application tools. In our case, a single invoice page design helped us to print all the customer purchase details. These reports are beneficial for the companies when the data is huge, and a common design needs to be used.
Get Certified for Power BI: Microsoft [DA-100]
Microsoft provides Microsoft Certified Data Analyst Associate [DA-100] Certification, which is beneficial for BI/Data Analysts or professionals involved in creating BI reports for solving business problems. It endorses your Power BI skills in the market and helps you unlock Power BI to its full potential. This is beneficial since Power BI has vast capabilities to help businesses create rich visualizations and data apps that are well tailored for their needs.
References
- Introduction to Microsoft Power BI Platform | Everything You Must Know
- Microsoft Certified Data Analyst Associate [DA-100]: Everything You Need To Know
- Microsoft Certified Data Analyst Associate [DA-100] Step By Step Activity Guides (Hands-On Labs)
Next Steps to begin with DA-100 Certification:
In our Microsoft Data Analyst Associate Certification Training Program, we’ll cover 11 Hands-On Labs. If you wish to start your journey towards becoming a Microsoft Certified: Data Analyst Associate, try our FREE CLASS.

The post How to Create Paginated Reports in Power BI appeared first on Cloud Training Program.