
This blog post covers Hands-On Labs that you must perform in order to learn to Microsoft Power BI Data Analyst & clear the PL-300 Certification and become a Microsoft Certified Power BI Data Analyst Associate.
This post helps you with your self-learning as well as for your team learning. There are 10 Hands-On Labs in this course.
- Prepare Data in Power BI Desktop
- Load Data in Power BI Desktop
- Model Data in Power BI Desktop
- Create DAX Calculations in Power BI Desktop – Part 1
- Create DAX Calculations in Power BI Desktop – Part 2
- Design a Report in Power BI Desktop – Part 1
- Design a Report in Power BI Desktop – Part 2
- Create a Power BI Dashboard
- Perform Data Analysis in Power BI Desktop
- Enforce Row-Level Security
LAB 1: Prepare Data In Power BI Desktop
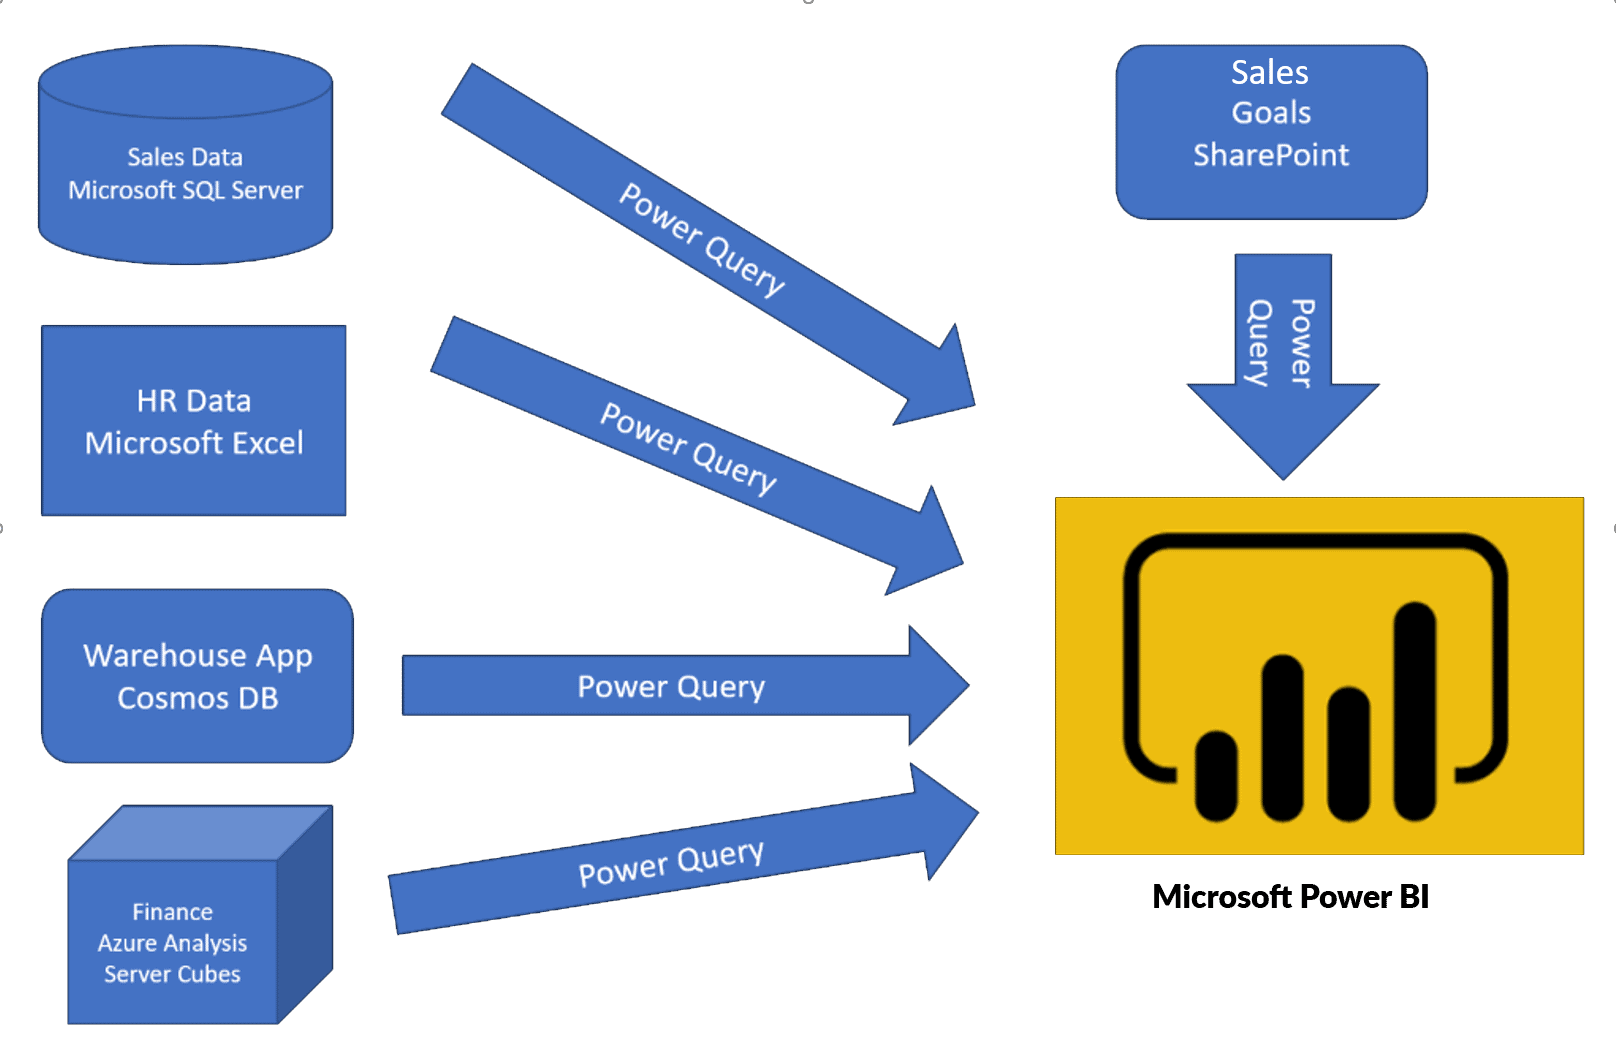
Before you will create reports in Power BI, you first need to first extract data from the data sources. Power BI Desktop allows you to get data from different types of files. When you click on the Get data feature in Power BI then you can find a list of the available options from where you can import your data.
In this lab, we will focus on the first step, of getting the data from the many different data sources and importing it into Power BI by using Power Query.
LAB 2: Load Data In Power BI Desktop
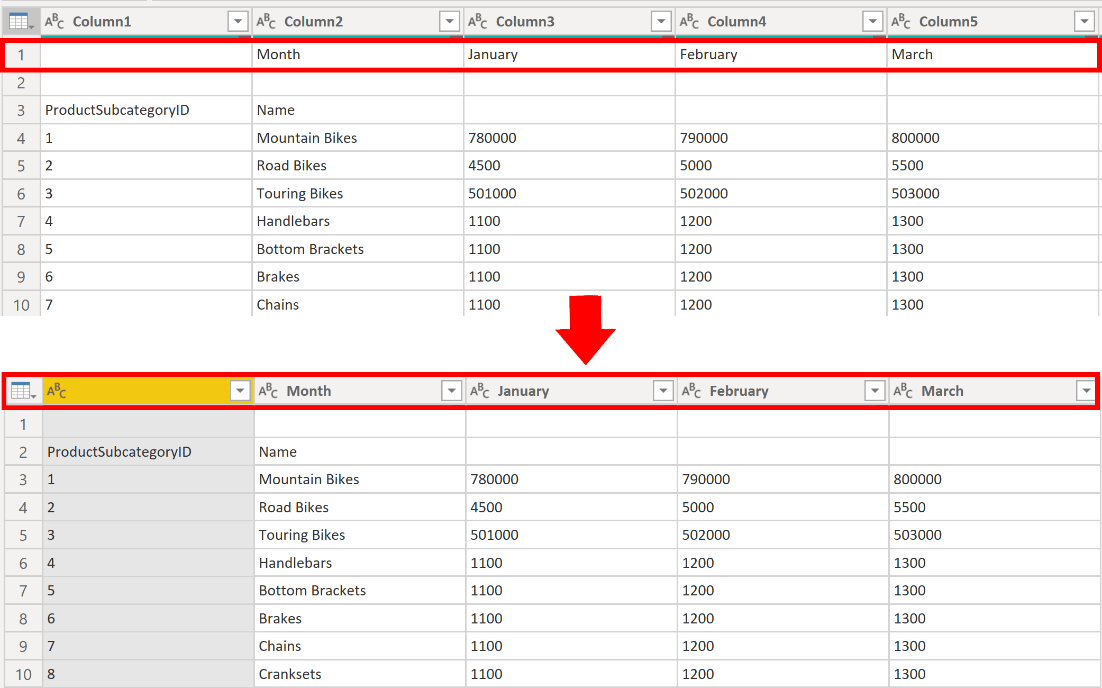
Consider the scenario where you’ve got imported data into Power BI from several different sources and, when you examine the loaded data, it is not well prepared for analysis. What could make the data unprepared for analysis?
Power BI and Power Query come with a powerful environment to clean the raw data and prepare the data. In this lab, you will learn how to transform raw data with Power Query Editor in Power BI Desktop.
LAB 3: Model Data In Power BI Desktop, Part 1
In this lab, you’ll initiate developing the data model. It’ll involve creating relationships between tables, and then configuring table and column properties to enhance the friendliness and usability of the data model. You’ll also create hierarchies and create quick measures.
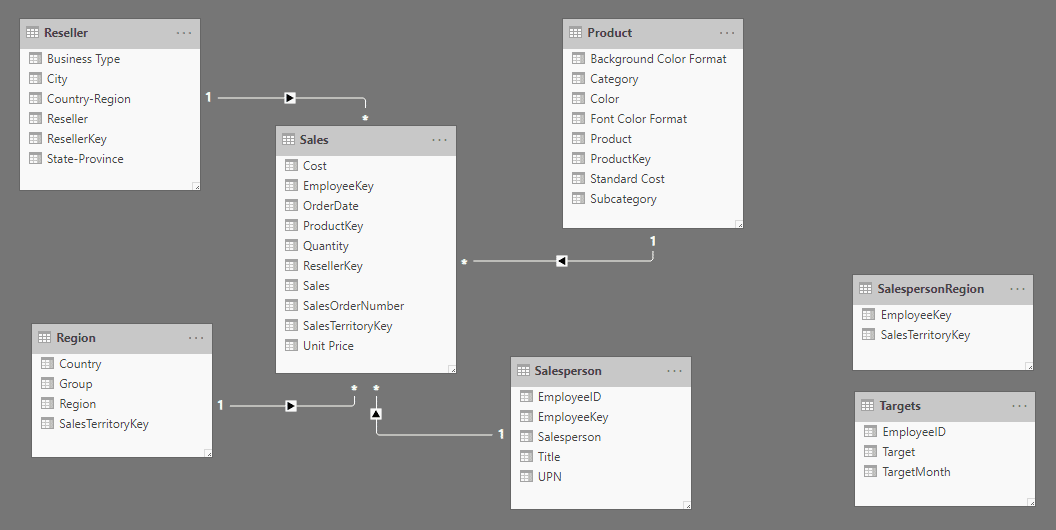
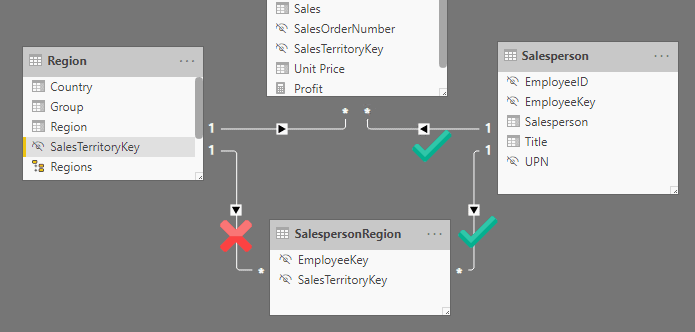
In this lab, you’ll create a many-to-many relationship between the Sales table and the Salesperson table. You’ll also implement row-level security to secure that a salesperson can only analyze sales data for their assigned region(s).
LAB 4: Create DAX Calculations In Power BI Desktop, Part 1
DAX [Data Analysis Expressions] is a programming language that is used throughout Power BI for creating calculated columns, measures, and custom tables. It is a collection of operators, functions, and constants that can be used in an expression, or formula, to calculate and return one or more values.
In this lab, you’ll create calculated columns, calculated tables, and simple measures using Data Analysis Expressions (DAX).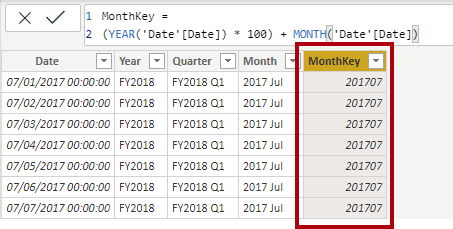
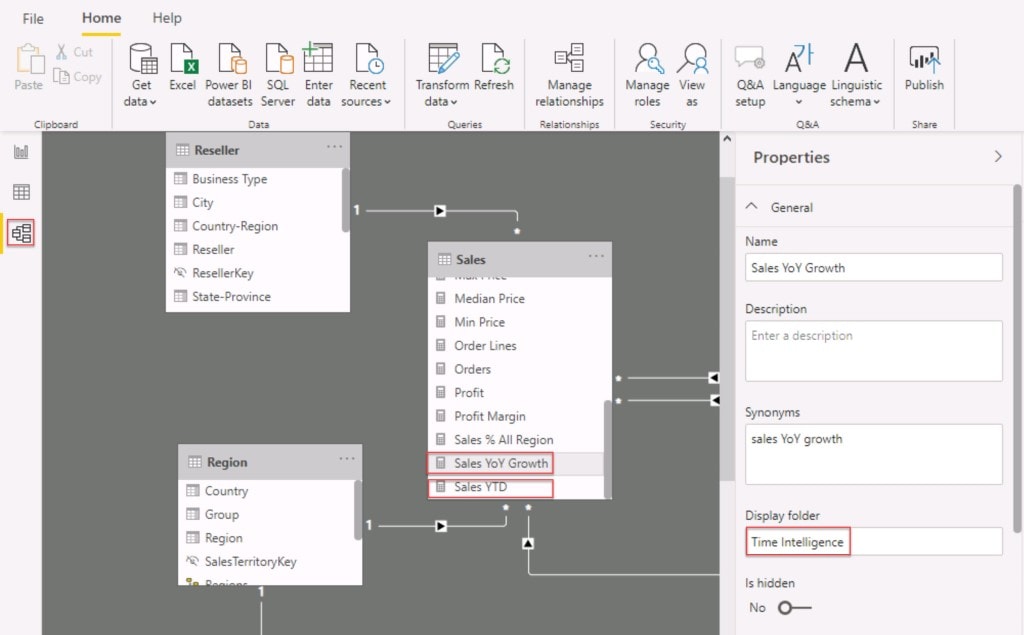
LAB 5: Create DAX calculations In Power BI Desktop, Part 2
In this lab, you’ll create measures with Data Analysis Expressions involving filter context manipulation and you’ll use Time Intelligence functions.
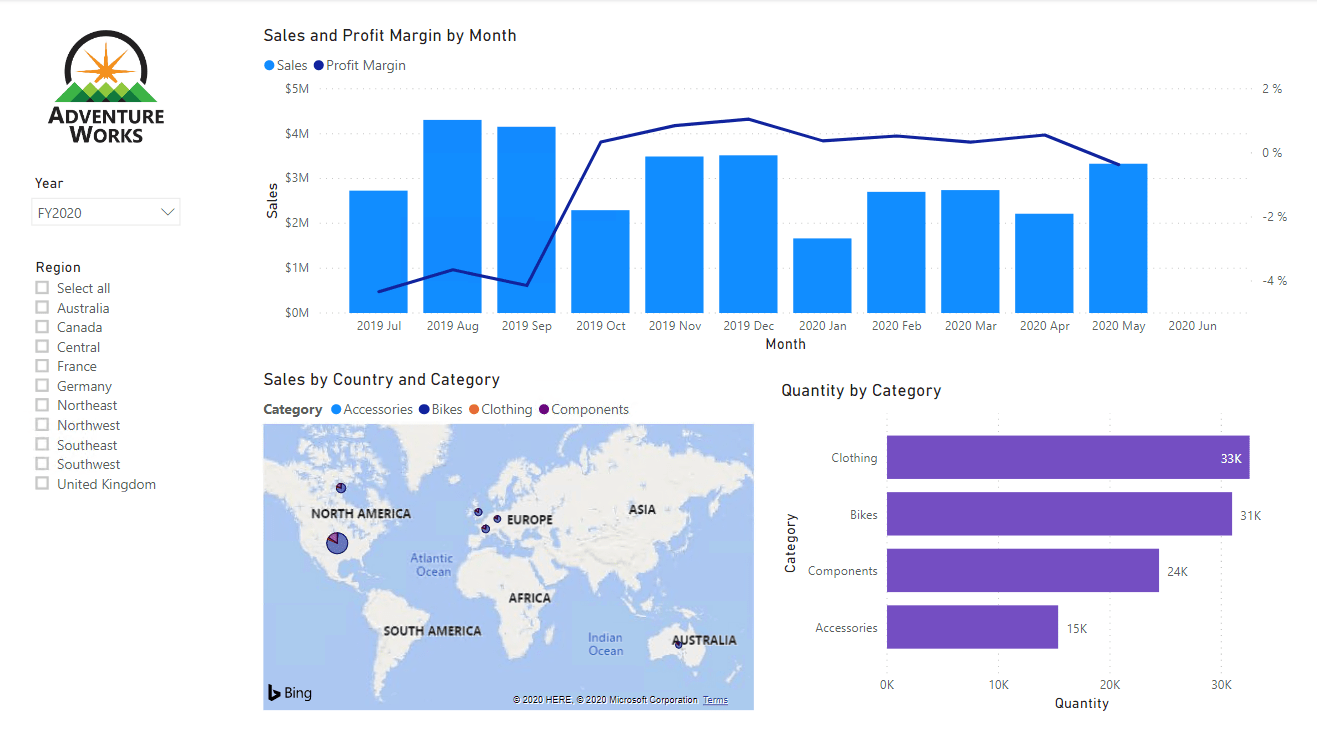
LAB 6: Design A Report In Power BI Desktop – Part 1
Power BI visuals are attractive graphics and charts that you can use to modernize your data. Visuals allow you to share data intuition more effectively and increase retention, comprehension, and appeal. After you’ve loaded your data and modeled it in Power BI Desktop, you will be ready to start creating your reports.
In this lab, you’ll create a three-page report and then you’ll publish it to Power BI, where you can easily open and interact with the report.
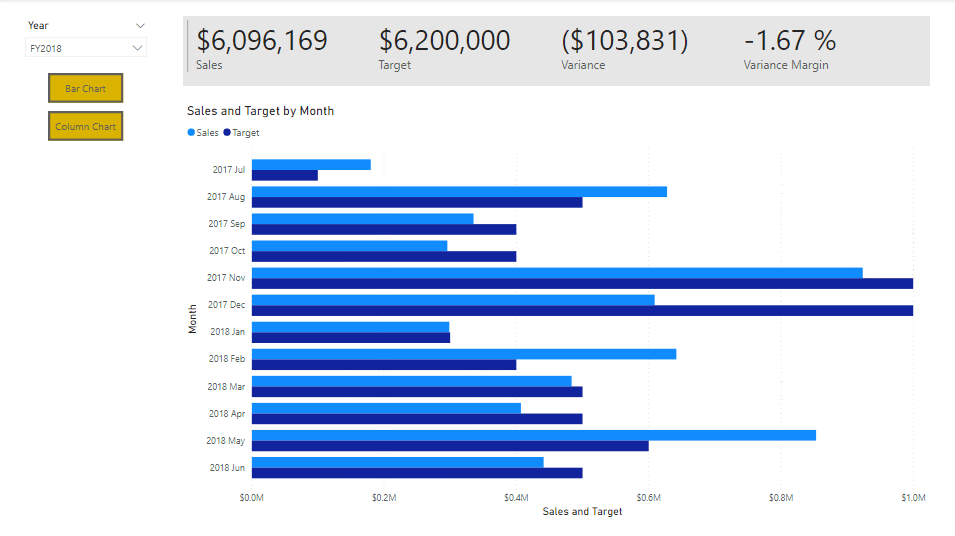
LAB 7: Design A Report In Power BI Desktop, Part 2
In this lab, you’ll enhance the Sales Analysis with advanced interactions and drill through features. You’ll learn how to work with Sync slicers and Drill through features. You’ll also Add bookmarks and buttons to your reports.
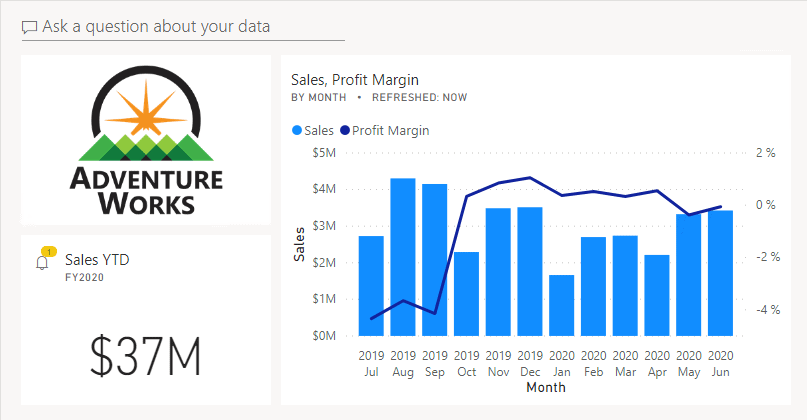
LAB 8: Create A Power BI Dashboard
Power BI reports and Power BI dashboards are not the same. Dashboards allow report consumers to create a single output of directed data that is personalized just for them.
Dashboards can be composed of pinned visuals that are taken from different reports. Where a report uses data from a single dataset and a dashboard can contain visuals from many different datasets.
In this lab, you’ll create the Sales Monitoring dashboard.
LAB 9: Perform Data Analysis In Power BI Desktop
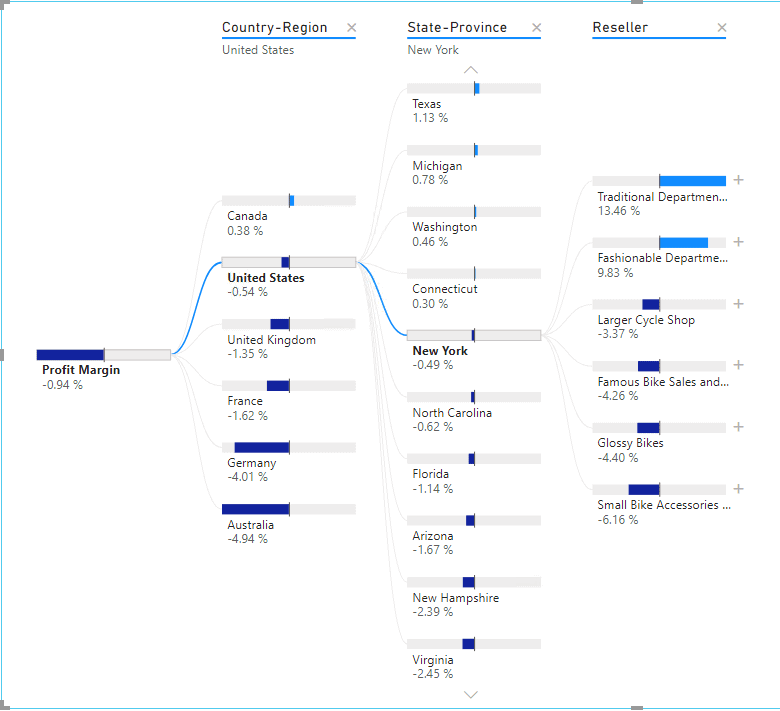
In this lab, you’ll use the AI aspect of the advanced analytic capabilities of Power BI to enhance your reports in good ways. In this lab, you’ll create a forecast to determine possible future sales revenue. You’ll create a decomposition tree and using the Key influencers AI visual to determine what influences profitability.
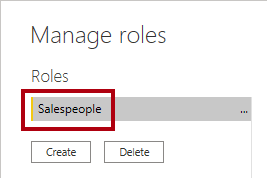
LAB 10: Enforce Row-level Security
In this lab, you will enforce row-level security to ensure a salesperson can only ever see sales made in their assigned region(s). For example : you will enforce row-level security to ensure a salesperson can only see sales made in their assigned region.
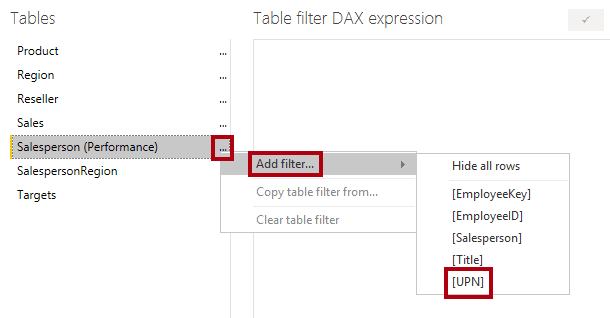
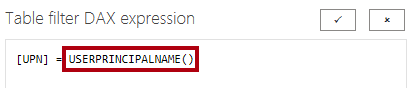
USERPRINCIPALNAME() is a Data Analysis Expressions (DAX) function that returns the name of the authenticated user. It means that the Salesperson (Performance) table will filter by the User Principal Name (UPN) of the user querying the model.
This is the list of activity guides/hands-on required for the preparation of the PL-300 Microsoft Power BI Data Analyst Exam.
Related References:
- Microsoft Certified Data Analyst Associate [DA-100]: Everything You Need To Know
- Case Study: Getting Started with Microsoft Azure Power BI
- Microsoft Power BI VS Tableau | Which one is Better?
- Introduction To Data Analysis Expression (DAX) In Power BI
- Introduction To Power Query | Microsoft Azure Power BI Tool
Next Steps to begin with PL-300 Certification:
In our Microsoft Power BI Data Analyst Associate Certification Training Program, we’ll cover 10 Hands-On Labs. If you wish to start your journey towards becoming a Microsoft Certified: Power BI Data Analyst Associate, try our FREE CLASS .
The post Microsoft Power BI Data Analyst Associate [PL-300] Step By Step Activity Guides (Hands-On Labs) appeared first on Cloud Training Program.