
This blog post covers a brief overview of the topics covered and some common questions asked on Day 2 Live Interactive training on Microsoft Data Analyst Associate [DA-100]
This post will help you learn about Clean, Transform, and loading the data in Power BI and prepare you for the certification and get a better-paid job in the field of Data Analyst.
On our Day 2 Live Session, we have covered how to Simplify the Data Structure, Profile the Data, Power Query, Combining Multiple tables into single, and performed hand-on Lab 2 out of 11 hands-on Labs. We learned about how to apply various transformations and apply queries to load them to the data model and many more.
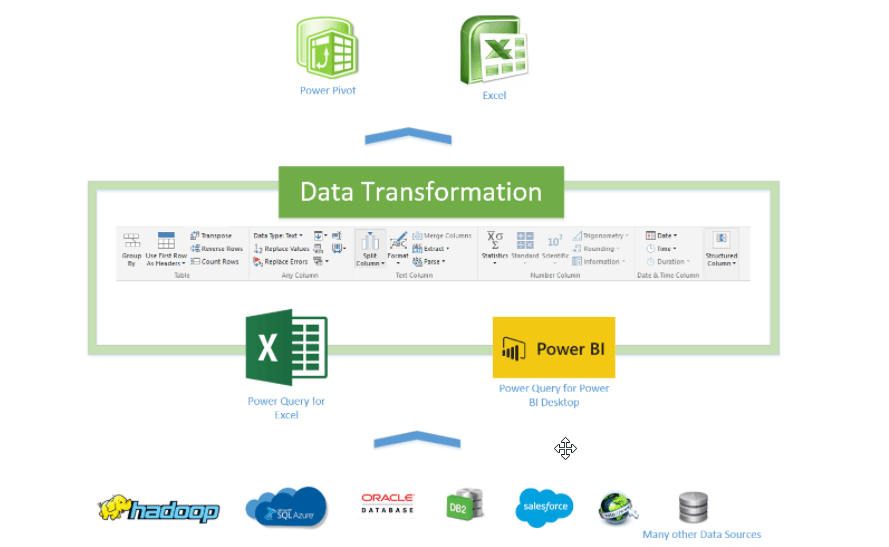
>Power Query Editor
- Power Query Editor in Power BI Desktop allows you to shape (transform) your imported data.
- Actions such as renaming columns or tables, changing text to numbers, removing rows, setting the first row as headers, and much more can be accomplished.
![]()

Source: Microsoft
>Shape the Initial Data
- After importing data from various sources. We need to shape the data
- To shape the data we can use Power Query Editor
- editor helps us to shape the data like we can rename the columns or rows, changing texts to numbers, etc.
- When our data is flat, and we wanted to convert our data into a table, we can use the Pivot columns feature.
- Pivot columns enable us to convert flat data into a table that contains an aggregate value for each unique value in the column.
![]()
Source: Microsoft
>Simplify the Data Structure
- When you import data from multiple sources into Power BI Desktop, the data retains its predefined table and column names.
- You might want to change some of the names so that they are in a consistent format, easier to work with, and more meaningful to a user.
- You can use Power Query Editor in Power BI Desktop to make these name changes and simplify your data structure.
>Minimizing Errors using Power Query Editor
- When you import a table from any data source, Power BI Desktop automatically starts scanning the first 1,000 rows (default setting) and tries to detect the type of data in the columns.
- Some situations might occur where Power BI Desktop does not detect the correct data type. Where incorrect data types occur, you will experience performance issues.
- You may get a higher chance of getting data type errors while dealing with flat files, such as comma-separated values (.CSV) files and Excel workbooks (.XLSX), because of entering the data manually into the worksheets and mistakes were made.
- So the best practice is to evaluate the column data types in Power Query Editor before you load the data into a Power BI data model
>Profile Data in Power BI
- Profiling data means studying every detail of the data
- It can be identifying anomalies, detecting errors.
- After examining the data, it moves forward for query statistics like row counts, maximum and minimum value, etc.
- This is the most important concept in the whole data analyst process as it allows us to shape and organize the data
- If the data is well organized we can interact with it easily
- We can make reports with fewer efforts

Source: Microsoft
>Combining Multiple Rows into Single Table
- When too many tables exist, it will be difficult to navigate an overly complicated data model.
- Several tables have a similar role.
- In a table, only a column or two can fit into a different table
- You want to use several columns from different tables in a custom column.
We can join two tables together in the following ways:
FAQ Asked during the Session:
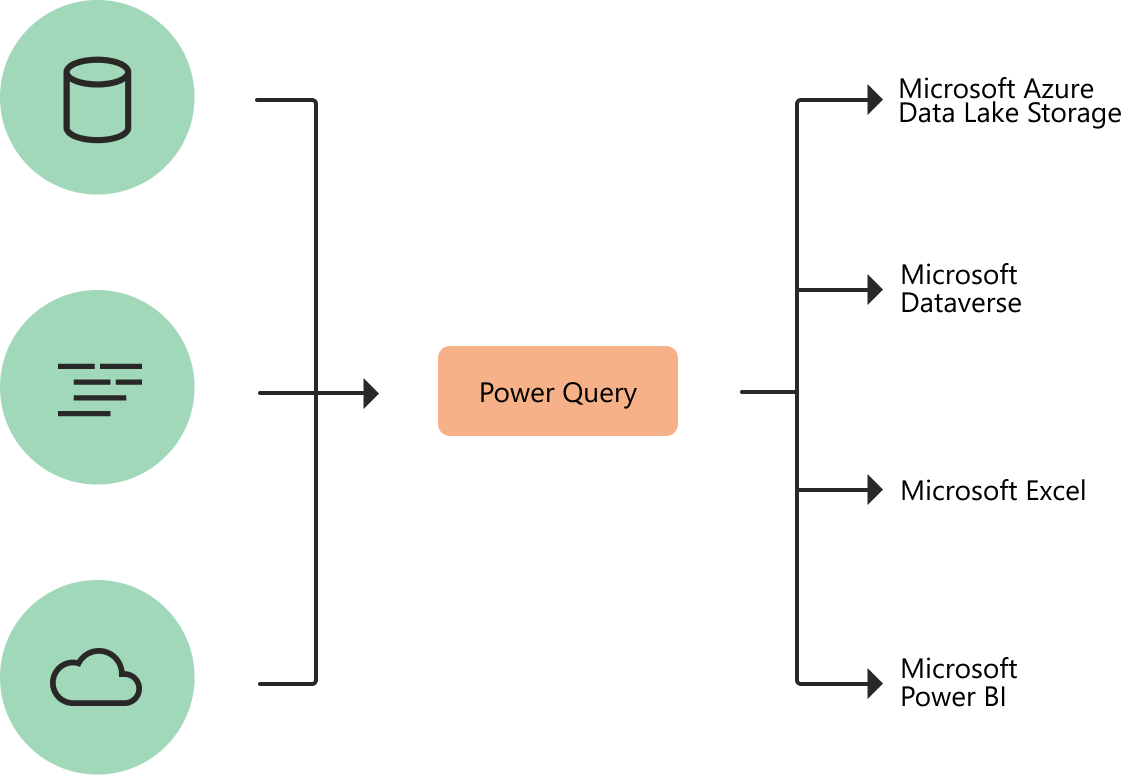
Q1:What is a Power Query?
A. Power Query is a data transformation and data preparation engine. Power Query comes with a graphical interface for getting data from sources and a Power Query Editor for applying transformations.
Source: Microsoft
Power BI Service is a cloud-based service where users interact with the reports and view. The desktop application is used by Report Designers to publish the Power BI reports to the Service.

Q10:What are Data Anomalies?
A. Data anomalies are outliers within our data.
Quiz Time (Sample Exam Questions)
With our Microsoft Data Analyst Associate, we cover Over 100+ Sample questions to help you prepare for the Certification [DA-100]
Check out these Questions:
Comment your answer in the comment box.
References
- Microsoft Certified Data Analyst Associate [DA-100]: Everything You Need To Know
- Microsoft Certified Data Analyst Associate [DA-100] Step By Step Activity Guides (Hands-On Labs)
- What is Power Query | Microsoft Azure Power BI Tool
- How to Transform Data in Power BI – Clean and Load Data in Power Query
Next Steps to begin with DA-100 Certification:
In our Microsoft Data Analyst Associate Certification Training Program, we’ll cover 11 Hands-On Labs. If you wish to start your journey towards becoming a Microsoft Certified: Data Analyst Associate, try our FREE CLASS.

The post Microsoft Data Analyst Associate DA-100 Training | Day 2 Q/A Review appeared first on Cloud Training Program.